Ask a merchandising team why they're out of stock on a bestseller and they'll often point to forecasting. Ask finance why the warehouse is full of product nobody's buying, and forecasting comes up again. Same suspect, opposite symptom, same week — which makes it tempting to conclude there's one single cause behind both.
There usually isn't. Forecasting is one important contributor, but it's rarely the whole story. Stockouts and overstock most often show up together when inventory looks healthy at the network or category level while being badly misaligned at the SKU-location level — and several different mechanisms, not just forecast error, can create that misalignment.
Quick answer
Stockouts and overstock frequently happen at the same time because retailers plan and review inventory at an aggregate level — category, region, or network — where problems in opposite directions can offset each other and look fine on a dashboard. At the SKU-location level, where a specific product either is or isn't on a specific shelf, that same "healthy" picture can hide real shortages and real excess simultaneously. Forecast error is one common contributor to this gap. Inventory misallocation, ordering constraints, and execution problems can produce the identical outcome even when the forecast itself is reasonably accurate.
The Paradox, in Numbers
This isn't a niche problem. IHL Group, which has tracked what it calls "inventory distortion" — the combined cost of stockouts and overstock — for close to two decades, put the global annual cost at $1.77 trillion in its most recent research covering 2025. Out-of-stocks accounted for roughly $1.2 trillion of that figure, with overstock-driven markdowns, spoilage, and write-offs making up the remaining $570 billion or so. Stockouts represent the larger share, but overstock is far from a rounding error.
Stockout frequency on its own is well documented too. Purdue University's Center for Food Demand Analysis and Sustainability runs an ongoing consumer survey that found 9.5% of U.S. shoppers reported encountering an out-of-stock food item in the prior 30 days as of late 2024 — down from 12.3% in 2023 and 19.3% in 2022. That's a self-reported shopper metric, not a transaction-level SKU rate, but it tracks the same underlying problem from the customer's side.
None of these numbers describe two separate populations of retailers — one chronically out of stock, another drowning in excess inventory. In most networks, it's the same retailer, the same week, different aisles.
Why "Better Forecasting" Alone Doesn't Fix It
The default response to this problem is almost always "we need better forecasts." Teams invest in new planning software, hire a data scientist, tighten the sales & operations planning cadence — and six months later, they're still running the stockout meeting and the markdown meeting in the same conference room.
That's often because forecasting improvements get measured at the level leadership actually reviews — category, region, or total network — and a forecast can be genuinely accurate at that level while still being wrong underneath it, for reasons that have nothing to do with the forecasting model itself.
One Common Pattern: When Aggregate Numbers Hide SKU-Location Reality
How Aggregation Can Mask the Real Problem
Here's a mechanism worth understanding in detail, because it's one of the more counterintuitive reasons this problem persists.
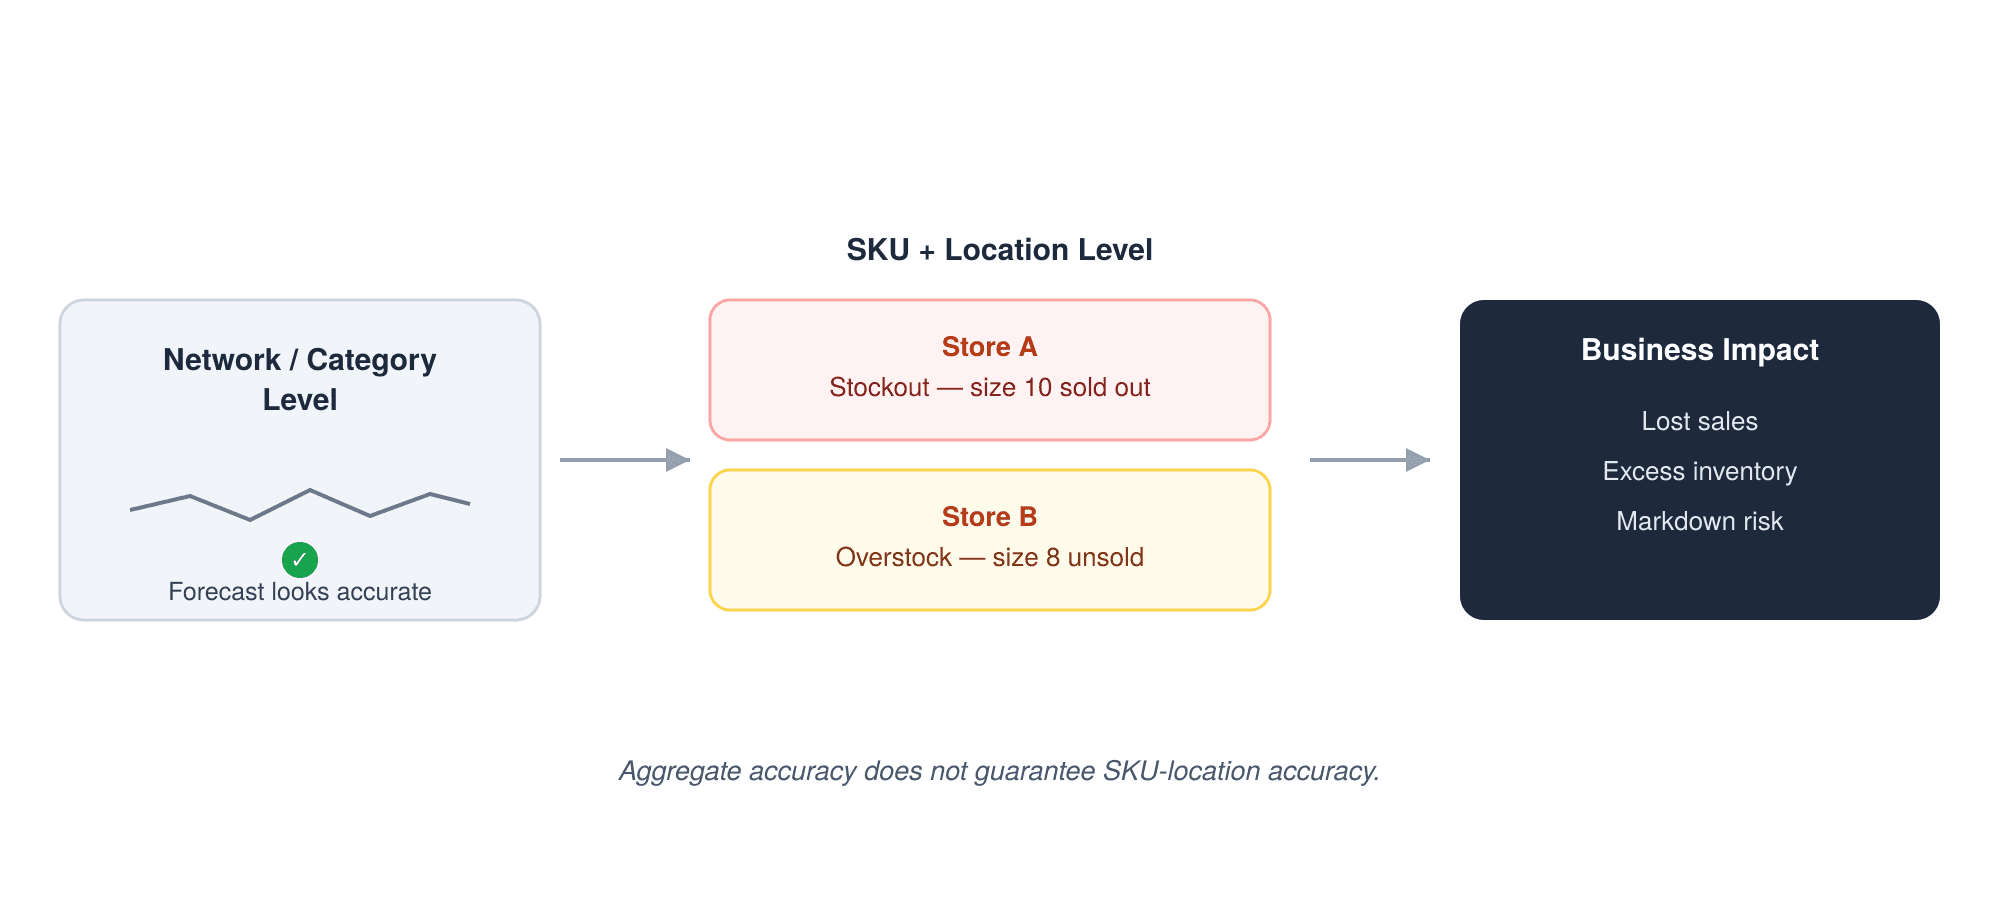
Imagine a retailer forecasts demand for a product category across 200 stores. At the total-network level, the forecast lands within 2% of actual demand — by any normal standard, an excellent forecast.
Roll that same product down to individual store-SKU combinations, though, and the picture can look very different. Some stores run well below forecast, others well above. Because the errors point in opposite directions, they largely cancel out once added back up to the network total. The dashboard says "on plan." The stockroom tells a different story.
This pattern is well documented in forecasting practice. RELEX Solutions, a supply-chain planning vendor, notes in its own guidance on measuring forecast accuracy that when errors are aggregated, they can largely cancel out — producing a group-level forecast that looks highly accurate while masking item-level bias that still drives excess stock in some places and missed sales in others. In other words: the aggregate number can be honestly accurate and the SKU-location reality can still be broken.
It's worth being precise about what this does and doesn't prove. It shows that aggregate accuracy doesn't guarantee SKU-location accuracy — not that forecasting error is the primary driver of stockouts and overstock industry-wide. The sections below cover mechanisms that can produce the same pattern even when the underlying forecast is reasonably good.
A Simple Example
Picture a running shoe that sells well nationally. Demand planning looks at total sell-through, sees a healthy trend, and sets a network-wide reorder quantity that looks entirely reasonable on paper.
But sell-through isn't even across stores. Size 10 sells out in the first two weeks at a handful of high-traffic urban locations, while size 8 sits largely untouched at several suburban stores that never needed that much depth. The category-level number — total units sold versus total units forecast — still looks close to plan. Nobody flags an issue in the weekly review. Meanwhile, the size-10 stores are losing sales to a competitor down the street, and the size-8 stores are heading toward a markdown in eight weeks.
Multiply that pattern across a few thousand SKUs and a few hundred stores, and you get the pattern in the numbers above: stockouts and overstock happening at the same time, inside a forecast that would score "accurate" by most standard measures.
Four Different Problems That Can Produce the Same Result
It's worth separating out what's actually happening underneath "we have stockouts and overstock at the same time," because the fix is different depending on the cause:
- Forecasting error — the predicted demand itself is wrong, at whatever level it's measured.
- Inventory allocation — the forecast may be fine, but stock is sitting in the wrong DC or store.
- Replenishment and ordering constraints — the forecast and allocation may both be fine, but case packs, minimum order quantities, or long lead times prevent ordering the actual right amount at the actual right time.
- Execution and supply problems — the plan may be entirely correct on paper, but shrink, receiving errors, or supplier shipment failures mean the inventory records don't match reality.
A retailer can have a relatively accurate forecast and still experience both stockouts and overstock because of any one of the last three. Retailers may recognize more than one of these as live issues, not all four at once — the point of separating them is to diagnose which apply to you rather than treating inventory distortion as a single undifferentiated forecasting problem.
Mechanisms That Create or Widen the Gap
Inventory Misallocation
Sometimes the network has close to the right total amount of stock — it's just in the wrong place. A product might be sitting in a distribution center or an underperforming store while the location with real demand shows an empty shelf. IHL Group's research attributes roughly $145 billion a year in losses specifically to product-location failures of this kind — inventory that exists, just not where the customer is standing.
Replenishment and Ordering Constraints
Even a forecast that's precisely right down to the unit can't always be executed precisely. Suppliers ship in case packs, pallets, or minimum order quantities, and a store that needs 14 units might be forced to order 24 or none at all. Longer or less predictable lead times compound the same problem: the further out a forecast has to reach, the more a small demand shift can turn into either a stockout or an overstock by the time the product actually arrives. Neither of these is a forecasting failure in the traditional sense — they're constraints on how precisely a good forecast can be translated into an actual order.
Execution and Supply Problems
Sometimes the plan is right and the execution isn't. Shrink and theft distort inventory records so a system believes stock is on hand when it isn't, which suppresses reorders and creates a stockout that no forecast could have prevented. Supplier shipment errors, late deliveries, and receiving mistakes have the same effect in the other direction. IHL Group's research attributes more than $500 billion annually to theft-related losses and over $300 billion to supplier missteps — costs that sit entirely outside the forecasting process.
Organizational Incentives
This one is structural rather than technical. Finance is typically measured on cash conservation and inventory turns — carrying less stock. Merchandising and store operations are typically measured on service levels and sales — carrying enough stock to avoid missing them. Both targets are individually reasonable and pull in opposite directions on the same SKU. Without a shared, granular view of where the real risk sits, each team optimizes locally, and the business can end up with more of both problems than either team intended.
The Safety Stock Trap
Faced with a stockout problem, the fastest available lever is almost always the same one: raise safety stock. It's an understandable instinct — more buffer should mean fewer misses.
The nuance matters here. Targeted safety stock — added at the specific SKU-locations where demand uncertainty genuinely warrants it — can meaningfully reduce stockouts without much downside. The trouble is a broad, network-wide increase applied because the aggregate stockout rate looks high. That kind of adjustment gets made at the same level of aggregation where the original blind spot lives, so it adds buffer everywhere, including at locations that are already overstocked. A broad increase in safety stock can reduce some stockout risk while increasing excess inventory and carrying costs. The fix isn't "less safety stock" — it's safety stock set at the level where the actual risk lives, not the level where it's easiest to review.
How to Tell Which Cause Is Driving Your Imbalance
Before choosing a fix, it's worth diagnosing which of the mechanisms above is actually driving your specific imbalance. A few questions tend to separate them quickly:
- Does your forecast accuracy look good at the category or network level, but you can't say with confidence how accurate it is at the SKU-store level? → Worth investigating aggregation masking.
- Is total inventory roughly where it should be, but stockouts and overstock are concentrated in different locations? → Likely misallocation.
- Are your reorder quantities frequently rounded up or down by a supplier's case pack or MOQ, or do your worst imbalances trace back to long or unpredictable lead times? → Likely a replenishment or ordering constraint.
- Do your inventory records regularly disagree with a physical count, or do supplier shipments arrive short, late, or wrong? → Likely an execution or supply-side problem, not a planning one.
- Do finance and operations disagree on target inventory levels for the same categories? → Likely an incentive-alignment issue.
Most retailers will recognize more than one of these — that's normal. The point isn't to find a single villain; it's to stop treating the whole problem as one undifferentiated "forecasting issue" that a single dial can fix.
If you want a structured way to work through this against your own numbers, RetailBrain's inventory imbalance self-assessment walks through each of these mechanisms against your own inventory data and flags which ones are most likely driving your specific gap.
What Actually Breaks the Cycle
The common thread across most of these mechanisms is granularity. Stockouts and overstock stop looking like a paradox once inventory is planned, reviewed, and — where possible — acted on at the level where the customer actually experiences it: a specific SKU, at a specific location, on a specific day, rather than only at the category or network rollup.
That doesn't mean throwing out aggregate reporting; leadership still needs a network-level view to run the business. It means treating SKU-location accuracy as a metric in its own right rather than assuming it's fine because the rollup looks fine, and building allocation and replenishment logic that can act at that level automatically — because manually reviewing hundreds of thousands of SKU-location combinations is impractical for most planning teams. This is also where a lot of multi-store inventory management and general inventory optimization efforts tend to plateau: the tools exist to manage the network total, but not always the granular reality underneath it.
That's the specific gap RetailBrain's demand forecasting and inventory allocation tools are built to help close — surfacing SKU-location imbalances while they're still cheap to fix, rather than after they've become next month's stockout report or next quarter's markdown.
Frequently Asked Questions
What is inventory distortion? Inventory distortion is the combined financial impact of stockouts and overstock across a retail network — lost sales from empty shelves plus the carrying costs, markdowns, and write-offs from excess stock. IHL Group has tracked this figure globally for close to two decades, most recently putting it at $1.77 trillion a year.
What's the actual difference between a stockout and overstock? A stockout means a customer wants to buy a product and it isn't available where they're shopping. Overstock means a retailer is holding more of a product than current demand justifies, tying up cash and shelf space. They're opposite symptoms, but as this article covers, they frequently trace back to the same aggregate-versus-SKU-location gap.
Is forecasting error the main cause of stockouts and overstock? Not on its own. Forecasting error is one contributor, but inventory misallocation, replenishment and ordering constraints, and execution or supply-side problems can all produce the same stockout-and-overstock pattern — even when the underlying forecast is reasonably accurate. Diagnosing which mechanism is driving a specific imbalance matters more than assuming it's always a forecasting issue.
Does adding more safety stock reduce stockouts? It can, if the extra buffer is added at the specific SKU-locations that actually need it. Added broadly across a network, it often reduces stockouts only slightly while increasing overstock at locations that didn't need the extra buffer in the first place.
How much does overstock actually cost retailers? Based on IHL Group's most recent global research (2025 data), overstock accounts for roughly $570 billion of the estimated $1.77 trillion in annual inventory distortion, with out-of-stocks making up the remaining $1.2 trillion. The exact cost for any individual retailer depends on category, markdown cadence, and how quickly excess stock is identified and cleared.
Curious where your own network stands?
Try our inventory imbalance self-assessment, or download the SKU-location forecast audit checklist to start diagnosing the gap yourself.
Take the AssessmentSources
- IHL Group, Fixing Inventory Distortion — most recent annual research (2025 data)
- RELEX Solutions, Measuring Forecast Accuracy: The Complete Guide
- Purdue University Center for Food Demand Analysis and Sustainability, Consumer Food Insights Report, December 2024